


A GCC Country Head recently lost her third senior GenAI architect in eight months — all to the same US-headquartered competitor a few kilometres away in Bengaluru. Compensation was similar. But her centre executed a product roadmap that arrived from Seattle. The competitor’s engineers owned theirs locally. She was not losing on salary. She was losing on mandate.
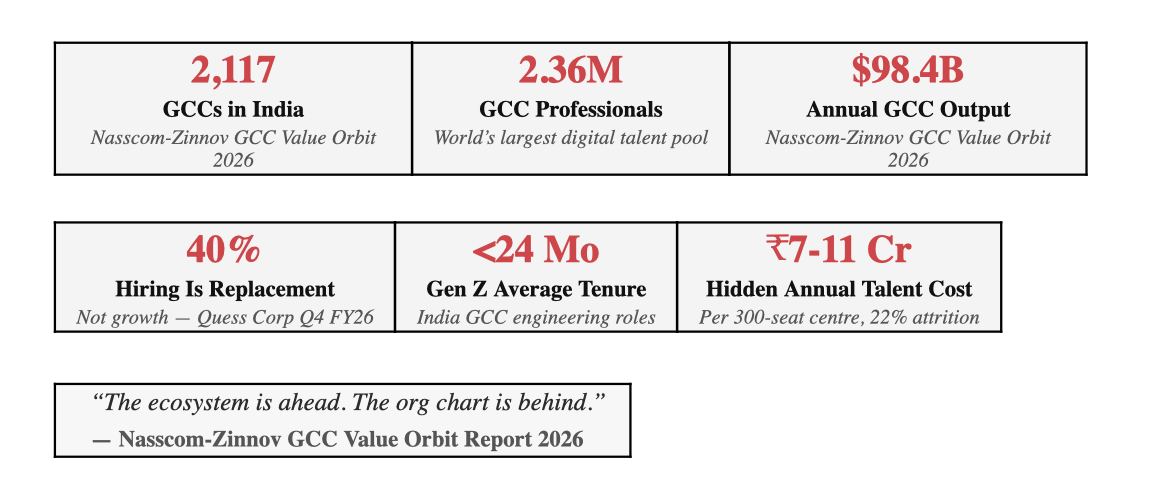
The Nasscom-Zinnov GCC Value Orbit Report 2026 captures this moment in eight words: “The ecosystem is ahead. The org chart is behind.” India’s 2,117 GCCs now employ 2.36 million professionals and generate $98.4 billion annually — the world’s largest pool of engineering and digital talent. In 2026, this talent is available. But it will not stay with mandates below its capability.
This edition of The 0.1% Intelligence Club breaks down what that means for your operations in H2 2026 — and what to do before your next talent review.
01 · The Signal Beneath the Recovery Numbers
Quess Corp’s Q4 FY26 GCC Tech Talent Landscape report documents GCC hiring rebounding 12–14% quarter-on-quarter — a real and measurable recovery after three quarters of selective optimisation. Enterprise confidence is back. Footprints are expanding.
But the number inside the headline matters more: 40% of that hiring is replacement, not growth. Four in ten current GCC hires simply backfill engineers who left. And the exit velocity is structural. Gen Z engineers in India now average less than 24 months per role — not because they are disloyal, but because the market has made optionality their default operating condition.
The Replacement Cost P&L Most GCC CFOs Have Not Calculated
The true cost of an engineer departure does not appear on any single P&L line. It distributes across HR, facilities, training, and manager overhead — which is why most GCC finance teams have not consolidated it as one number. Apply the formula:
|
Cost Component |
What It Represents |
Typical Magnitude |
|
Recruitment / Agency Fees |
External search costs, platform fees, referral payments |
10–15% of first-year salary per departure |
|
90-Day Productivity Gap |
Ramp time before new hire reaches productive output level |
25% of 3-month salary per departure |
|
Manager Knowledge-Transfer Drain |
Senior capacity consumed by onboarding and context transfer |
20–30% reduction in senior engineer output per departure |
|
Total Replacement Cost |
Annual departures × 50–75% of average annual salary |
Calculate for your centre — see below |
Applied: a 300-person Bengaluru GCC with 22% attrition (66 departures per year) and an average salary of ₹22 LPA faces an annual hidden replacement cost of ₹7–11 crore. This figure is distributed across recruiting, HR, training, and the senior productivity lost when engineers spend weeks on knowledge transfer instead of building product. Most GCC CFOs have not consolidated this as a single number. This is the prompt to do so.
02 · The Org Chart Problem — Why Your Best People Are Leaving
The Zinnov GCC Maturity Framework — applied to the 2026 dataset — classifies GCCs across four stages of mandate evolution. Understanding which stage your centre occupies is the most useful diagnostic available before the next talent review.
|
Stage |
India’s Role |
What Talent Experiences |
Attrition Risk |
|
Stage 1: Satellite |
Delivery execution. Roadmap arrives from HQ. No outcome ownership. |
Ceiling visible within 18 months. Exit decision made before counter-offer is possible. |
Highest — 30%+ senior cohort |
|
Stage 2: Centre of Excellence |
Deep domain expertise. Some product influence. P&L remains at HQ. |
Career extends but frustration compounds at 3-year mark when scope ceiling becomes clear. |
High — 22–28% |
|
Stage 3: Strategic Hub |
Regional P&L emerging. Engineers influence decisions, not only execute. |
Retention improves. Attrition concentrates in top 5–10% seeking full ownership. |
Moderate — 15–20% |
|
Stage 4: Portfolio Hub |
Full product/P&L ownership. India drives the global roadmap. |
Mandate matches capability. Counter-offers become irrelevant. Structural retention achieved. |
Lowest — 8–12% |
Only 27% of GCCs reach Portfolio Hub stage within their first five years. Most remain Satellites — offering capability at scale, but lacking outcome ownership. Senior talent (8–15 years experience) is acutely aware of this. They leave for competitors offering P&L accountability, not better pay. Counter-offers are ineffective because the decision to exit is made months before the conversation happens — the moment it becomes clear the mandate will not evolve.
Compounding this, 50% of GCCs lack predictive hiring data (GCC TalentScope India 2026, Ceipal × People Matters), forcing leadership to rely on attrition post-mortems rather than proactive retention architecture.
03 · Three Structural Shifts Rewriting the Talent Playbook
These are not emerging trends for H2 planning. They are active operational realities for any GCC with over 200 employees.
|
Structural Shift |
What Is Happening in 2026 |
The Required Response |
|
The GenAI Caste System |
Every scale GCC now operates two distinct workforces: AI/GenAI/platform engineers commanding 30–60% pay premiums (demand up 300% since 2024) — and everyone else. BFSI GCCs face a 42% AI skill gap driving 1.5x–2.5x premiums for this cohort. Uniform compensation models structurally fail AI engineers. They are irreplaceable within 90 days and will defect to competitors who differentiate. |
Segment the compensation architecture by cohort. The AI/ML retention model requires differentiated equity, project ownership structures, and comp bands that deviate from the standard engineering grid. A single compensation framework cannot serve both cohorts. |
|
The Internal Mobility Lever Nobody Is Pulling |
Per SHRM India’s 2025 Engagement Report, formal internal transfer policies (allowing moves every 24–30 months) cut senior attrition by 30–40% — the highest-impact non-financial retention lever documented. Yet only 27% of GCCs use it. Most default to external backfill, paying recruitment fees while losing engineers who would have stayed with an internal move. |
Implement a formal internal mobility framework with published 24–30 month transfer windows. Track internal mobility rate quarterly alongside attrition. Treat internal backfill as the default before any external recruitment process begins. |
|
The AI Adoption Gap Is an Org Design Problem |
The Infosys AI-First GCC Index 2026 found near-universal AI tool adoption, yet two-thirds of centres cannot demonstrate significant ROI, with AI enhancing only 31% of tasks. This is not a technology failure. It is an organisational design failure: engineers with tools but without decision authority cannot drive AI ROI. Meanwhile, 72% of GCCs offer long-term incentives but most fail to structure them competitively against startup equity at the 3–5 year mark. |
Assign AI outcome ownership explicitly — not just tooling access. Engineers given authority over AI adoption within their product domain demonstrate measurably higher retention and measurably better AI ROI. Restructure LTI vesting schedules to compete at the 3-year startup equity window. |
04 · City Strategy: The Mismatch That Is Quietly Compounding Costs
Most GCCs route all functions to Bengaluru by default. While senior CRE teams focus on headline occupancy costs, the operational mismatch — between function profile, talent availability, and city characteristics — compounds quietly across attrition, hiring cost, and productivity. These directional insights from industry data and Qdesq operator experience should be verified against your specific mandate and role mix.
|
City |
Recommended GCC Function |
Talent Reality |
Workspace Type |
Cost vs BLR ORR |
|
Bengaluru |
Deep-tech, AI/ML, GenAI, product, senior leadership |
Deepest talent pool in India; maximum optionality; 25–30% AI/ML senior attrition. Strongest ecosystem. |
Grade A managed office. ORR for premium; Metro-connected non-ORR for 15–25% cost advantage with equivalent talent access. |
Benchmark |
|
Hyderabad |
Scale engineering, BFSI GCC operations, tech operations, R&D |
Strong and growing pipeline; TS-iPASS and TASK ecosystem mature; stable policy environment. |
Managed office in HITEC City or Gachibowli. Pocharam, Kompally, Uppal for 2026–27 cost advantage. |
–18% |
|
Pune |
Product development, engineering scale, shared services |
Largest forward supply pipeline; highest occupier negotiating leverage among Indian metros currently. |
Managed office in Kharadi or Baner-Balewadi. Current market offers best lease terms of any major GCC city. |
–22 to 28% |
|
Chennai |
Campus-scale IT, retention-critical functions, long-tenure roles |
Lowest metro attrition among IT GCC cities. Strong academic pipeline. Best for 3-year stability mandate. |
Grade A campus or large managed office. Retention signal is embedded in campus quality and permanence. |
–20 to 30% |
|
Tier-2 Cities |
Function-specific spokes — cost-sensitive roles with defined skill profiles |
Talent quality varies significantly by function and city. Validate before committing infrastructure. Never the reverse. |
Always managed office pilot (50–100 seats) first. Permanent infrastructure follows validated talent — not the other way. |
–40 to 55% |
05 · The Workspace-Talent Connection Most GCC Leaders Miss
Workspace is not a separate conversation from talent. With AI/ML and senior engineering attrition running at 25–30%, the physical environment has become an operating model variable — not just a facilities line item.
Micro-Market Location Is a Retention Decision Variable
A senior GenAI engineer offered two roles at comparable compensation does cognitive math on commute time, peer density, and neighbourhood quality before signing. A Grade A campus with transit access on Bengaluru’s ORR retains differently than a peripheral industrial estate. This is not preference — it is documented decision behaviour in a high-optionality talent market. Micro-market selection belongs in the talent retention architecture, not only in the real estate cost model.
Managed Office Environments Signal Mandate Seriousness
GCCs competing for the top 5% of senior AI/ML talent consistently find that enterprise-grade, dedicated, configurable workspace signals a different level of organisational intent than a shared environment. Senior candidates read the physical environment as a proxy for how seriously the mandate will be treated. This is an EVP dimension that most GCC real estate reviews do not model — and one that Qdesq’s [QDESQ REF] GCC workspace consulting team incorporates into retention architecture recommendations.
Flex Is the Correct Entry Architecture for Tier-2 Expansion
As GCCs move to distribute talent into Tier-2 cities for cost and retention advantages, managed office and enterprise flex solutions allow the 50–100 seat pilot before any infrastructure commitment. The talent validates. The permanent space follows. Reversing that sequence — committing infrastructure before validating the talent pipeline — is the most common and most costly Tier-2 mistake Qdesq [QDESQ REF] observes across operator conversations. The fully-loaded talent cost model — replacement cost, AI/ML premiums, and attrition drag — makes workspace quality a financially defensible retention lever, impacting the talent journey from initial EVP signal to daily work experience.
Key Takeaways for H2 2026
• The mandate gap is the primary attrition driver. The ecosystem is ready for Portfolio Hub ownership. Most org charts are not keeping pace — and key talent is exiting to organisations where they are.
• 40% of GCC hiring is replacement, not growth. With hidden replacement costs hitting 50–75% of annual salary per departure, this is a significant and largely unmodelled P&L liability. Calculate it as a single number.
• Three structural shifts are active: GenAI engineers command 30–60% premiums and require segmented comp architecture; internal mobility — the highest-impact retention lever — remains unused at 27% adoption; and AI ROI stalls due to org design failure, not tool access.
• City strategy must align with function. Bengaluru for deep-tech and AI/ML; Hyderabad and Pune for scale; Chennai for retention. Tier-2 expansions must pilot with managed office before committing permanent infrastructure.
• Workspace is a retention variable. Senior AI talent evaluates micro-market location and office environment quality as proxies for mandate seriousness. Integrate these into your talent model alongside compensation — not only into real estate overhead.
Frequently Asked Questions
Why is GCC attrition so high in India despite competitive salaries?
The primary driver in 2026 is mandate gap, not compensation. Senior engineers at 8–15 years experience leave GCCs that position them as delivery centres executing roadmaps from HQ, for competitors offering product ownership, P&L accountability, and decision authority in India. Counter-offers are typically ineffective because the exit decision was made months before the conversation — at the point the career ceiling became clear.
What is the real cost of GCC talent attrition in India?
The fully-loaded replacement cost per departure is 50–75% of the departing employee’s annual salary: 10–15% in recruitment fees, 25% in a 90-day productivity gap, and 20–30% in senior engineer capacity consumed by knowledge transfer. A 300-person Bengaluru GCC with 22% attrition and ₹22 LPA average salary faces ₹7–11 crore in annual hidden replacement costs — distributed across HR, training, and management overhead.
What is the Zinnov GCC Maturity Framework?
The Zinnov GCC Maturity Framework classifies GCCs across four stages: Satellite (delivery execution), Centre of Excellence (domain depth), Strategic Hub (regional P&L emerging), and Portfolio Hub (full product ownership and global mandate). Only 27% of GCCs reach Portfolio Hub stage in their first five years. Attrition rates correlate directly with stage — Satellite GCCs face the highest senior attrition; Portfolio Hubs achieve structural retention.
What is the GenAI caste system inside GCCs?
The GenAI caste system refers to the structural bifurcation inside GCCs between AI/GenAI/platform engineers — commanding 30–60% pay premiums, facing 300% demand growth since 2024, and requiring differentiated retention architecture — and the broader engineering workforce. BFSI GCCs face a 42% AI skill gap driving 1.5x–2.5x premiums. Uniform compensation models structurally fail this cohort; they require segmented comp, equity, and mandate differentiation.
How does workspace quality affect GCC talent retention?
Senior AI/ML talent evaluates micro-market commute quality, peer density, and physical workspace quality as proxies for mandate seriousness before accepting offers. GCCs in Grade A managed office spaces in talent-dense, transit-accessible micro-markets retain differently than equivalent-compensation GCCs in peripheral or shared environments. The workspace decision is part of the retention architecture — not a separate real estate cost line.


