


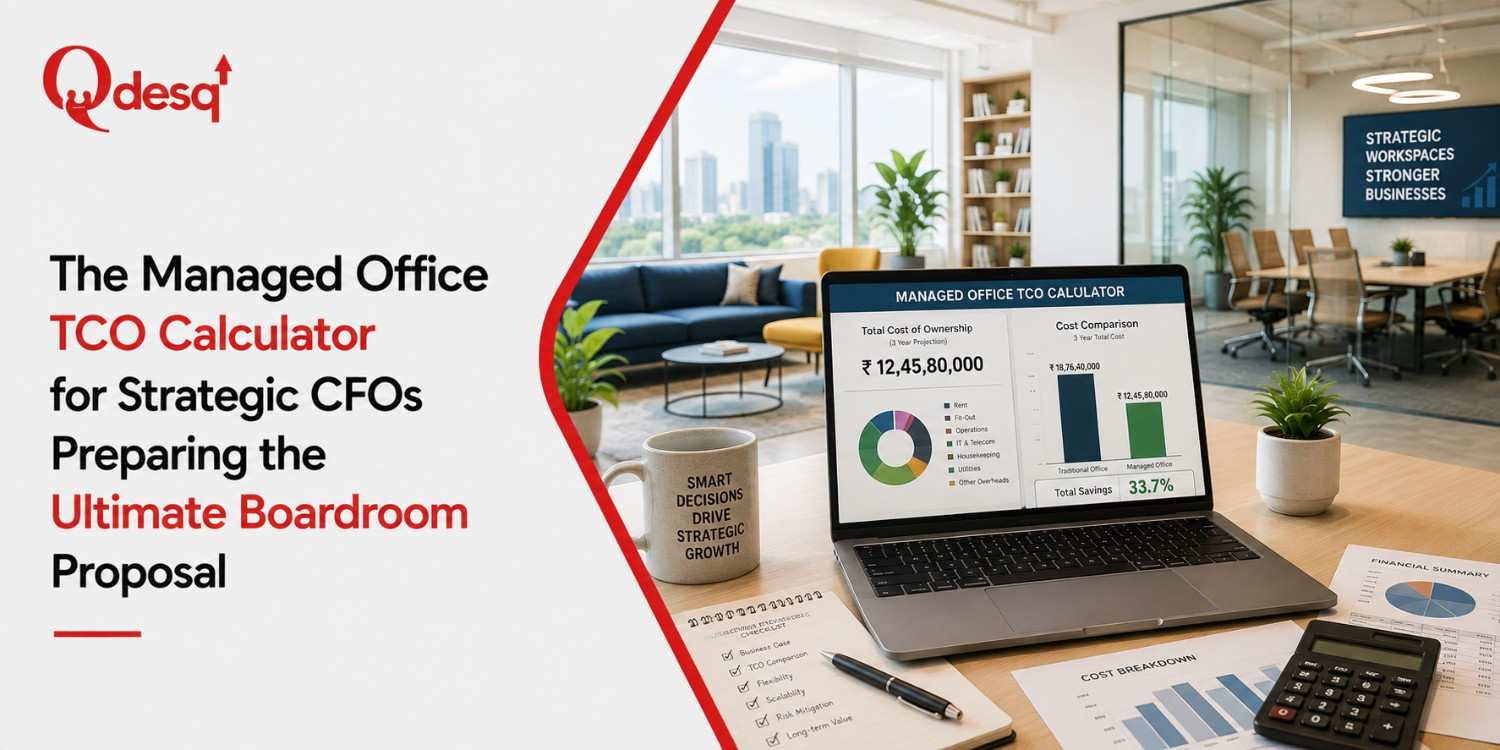
For CFOs and Finance Controllers preparing an office strategy proposal, the decision between a traditional lease and a managed office is fundamentally a capital allocation decision, not merely a real estate one.
Real estate typically represents 10–20% of overhead for most enterprises, making it one of the largest balance sheet items under CFO oversight. With India’s office market hitting record gross leasing volumes of 83.3 million sq. ft in 2025, up 7.8% year-on-year, and GCCs capturing a commanding 37.7% share of leasing activity, the stakes for getting the office cost structure right have never been higher.
Why Total Cost of Ownership Completely Replaces Standard Rental Metrics in Modern Office Planning
The Hybrid Dilemma and Its Cost Implications
Traditional lease evaluation stops at base rent per square foot, a metric that tells only part of the story. In today’s hybrid work environment, where teams may occupy offices only 3 days a week, a fixed traditional lease means paying for 40% of the space being wasted. This “vacancy tax” compounds with every other hidden cost line.
The 2026 Office Market Reality
- Pan-India Grade A office rents rose 3.8% year-on-year across Tier 1 cities
- Delhi rents surged 16.4% YoY, reflecting premium demand for scarce quality assets.
- Navi Mumbai recorded the fastest 3-year CAGR of 9.0%, making it India’s most resilient post-COVID office market.
- Mumbai’s CBD posted an exceptional 9.6% CAGR over five years.
Rent growth is structural, not cyclical. A shortage of Grade-A supply, combined with renewed in-office demand (led by tech, finance, and GCCs), is pushing effective rents higher across all major markets. See: Coworking Space Vs Managed Office Space for more.
Breaking Down the Full Cost Structure in a Traditional Lease
Upfront Capital Requirements and CAPEX
Before the first employee sits down, a traditional lease demands:
| Cost Component | Typical Range | 100-Seat Scenario (Bengaluru
Grade A) |
|---|---|---|
| Security Deposit | 6–12 months’ rent | ₹48–144 lakhs |
| Fit-out Construction | ₹1.5–3.5 crore | ₹1.5–3.5 crore upfront |
| Design & IT Infrastructure | Additional CAPEX | ₹20–50 lakhs |
| Stamp Duty on Lease
Registration |
2–5% of total lease value | ₹4–10 lakhs per year |
| Reinstatement (Dilapidation) | At least end | ₹10–20 lakhs |
Note on Deposit Caps: Under India’s New Rent Rules 2026, commercial security deposits are capped at six months’ rent, down from the 6–10 months previously demanded in large cities. This cap aims to reduce the financial burden on tenants, though legacy practices may still persist.
Operating Expenses and Hidden Operational Drains
Common Area Maintenance (CAM) Charges
CAM charges add 15–25% to the base rent in Indian commercial properties. These cover:
- Lobby and elevator maintenance
- Security services
- Landscaping
- Parking facilities
- DG set power backup CAM charges by city (average per sq. ft.):
| City | CAM Range (₹/sq. ft.) |
|---|---|
| Bangalore | ₹12–18 |
| Mumbai | ₹20–30 |
CAM charges are not static; new labour codes mandating higher minimum wages are projected to increase maintenance costs by 20-30%, forcing many societies to revise CAM charges upward.
Operational Overheads and Real Estate Management Salary Costs
A traditional lease requires managing 7–10 separate vendor contracts :
- Facilities management
- IT infrastructure and internet
- Security services
- Cleaning and housekeeping
- Pantry and consumables
- HVAC maintenance
- Utilities (electricity, water)
- Insurance
Full Traditional Lease TCO Formula
Total Traditional Lease TCO (24 months) = (Monthly Rent × 24) + CAM Charges (15-25% of rent) + Security Deposit (6 months’ rent upfront) + Fit-out CAPEX + IT Infrastructure CAPEX + Stamp Duty on Lease Registration + Operational Overheads (Admin Staff, Vendor Management) + Utilities and Electricity + Reinstatement Costs (at lease end) + Vacancy Tax (unused space)
The Managed Office Model and Predictable Monthly Costs
What a Managed Office Delivers
A managed office is a private, fully customised workspace operated end-to-end for a single monthly fee. The enterprise controls: For more, see: How to Choose Between Coworking, Managed & Virtual Office.
- Floor plan and brand environment: Custom office layout and branded interiors designed to match the enterprise’s identity and workflow.
- Network architecture: Dedicated, secure network infrastructure configured to support enterprise connectivity, performance, and business operations.
- Security configuration: Enterprise-grade physical and digital security controls tailored to organisational compliance and access requirements. Everything else, fit-out, facility management, IT infrastructure, utilities, and security, falls under the provider’s responsibility.
Managed Office Cost Structure
| Component | Managed Office Model |
|---|---|
| Security Deposit | 1–2 months’ rent only |
| Fit-out CAPEX | Zero |
| CAM Charges | Included in monthly fee |
| Utilities | Included |
| IT Infrastructure | Included |
| Facility Management | Included |
| Vendor Management | One provider handles all |
| Lease Term | 1–3 years (vs 5–9 years traditional) |
| Setup Timeline | ~90 days (vs 12–18 months) |
Side-by-Side TCO Comparison for a 100 Seat Bengaluru Scenario
Assumptions for 24-Month Horizon
Traditional Lease (100 seats, Bengaluru Grade A)
- Base Rent: ₹100/sq. ft./month × 10,000 sq. ft. = ₹10,00,000/month
- CAM (20% of rent): ₹2,00,000/month
- Security Deposit: 6 months = ₹60,00,000 upfront
- Fit-out CAPEX: ₹2,00,00,000
- IT Infrastructure: ₹30,00,000
- Operational Overheads: ₹2,00,000/month
- Utilities & Electricity: ₹1,00,000/month
| Cost Category | Traditional Lease (24 months) | Managed Office (24 months) |
|---|---|---|
| Base Rent | ₹2,40,00,000 | Included |
| CAM Charges | ₹48,00,000 | Included |
| Security Deposit | ₹60,00,000 (blocked capital) | ₹16,00,000 |
| Fit-out CAPEX | ₹2,00,00,000 | Zero |
| IT Infrastructure | ₹30,00,000 | Included |
| Operational Overheads | ₹48,00,000 | Zero |
| Utilities & Electricity | ₹24,00,000 | Included |
| Total Cash Outflow | ₹5,90,00,000 | ₹3,84,00,000 |
| Deposit Blocked Capital | ₹60,00,000 | ₹16,00,000 |
The Crossover Point
According to the analysis, the crossover point at which managed office TCO becomes comparable to or lower than a conventional lease typically occurs at 50–75 seats over 12+ months. The managed model delivers:
- 45% faster occupancy than traditional setup (90 days vs 12–18 months)
- 20–30% cost savings in build-out, with providers like PwC scaling from 400 seats to 8,000 seats at a cost below the budgeted self-managed build-out
Real-World Enterprise Case Studies
PwC India
- Started with a 400-seat pilot in Gurugram
- Scaled to ~8,000 seats across three cities
- Each successive location is delivered in 50–90 days.
- Cost consistently below internal budget for self-managed build-out
Microsoft
- 3,000-seat workspace across Hyderabad and Bengaluru
- Delivered in 120 days
- 20% below the internal budget
Shell
- 2,000-seat Bengaluru office
- Delivered in 120 days
- Cost savings exceeding 15%
Mastercard
- 1,000-seat Mumbai workspace
- 45% faster than the internal estimate for self-performance
Why this is Important Now with the GCC and Flex Surge
Record GCC Expansion in 2025
- GCCs captured a 37.7% share of gross leasing activity in 2025.
- Record-breaking 31 million sq. ft absorbed by GCCs—the highest annual figure ever.
- GCCs now represent approximately 50% of all active space requirements.
Flex Segment Momentum
- Flex was the largest occupier segment in Q4 2025 with a 26.6% share.
- Indigenous flex firms leased ~18 million sq. ft in 2025—their best performance ever.
- Flexible workspace inventory has tripled since 2020, crossing 100 million sq. ft.
The “Speed and Agility” Imperative
Harsh Lambah, Country Head (India) at IWG, articulates the shift: “Without any capex requirement or large investment from the GCC side, it makes it a win-win situation… When your business plans change, you don’t want to be stuck with space that you are paying for but not occupying”.
CFO Checklist for Preparing the Board Proposal
TCO Model Components to Present
- Base Rent – Headline rent per sq. ft.
- CAM Charges – Scrutinise at 15-25% of rent; audit historical CAM statements
- Security Deposit – 6-month cap under new rules; quantify opportunity cost of blocked capital
- Fit-out CAPEX – Include design, construction, furniture, IT
- Operational Overheads – Admin staff, vendor management, facilities team
- Utilities & Electricity – Power, AC, internet
- Stamp Duty & Registration – Varies by state; typically 2-5% of lease value.
- Reinstatement Costs – Dilapidation at lease end
- Vacancy Tax – Unused space in hybrid model
Sample Board Slide Framework
- Slide 1: The Headline → “Our 24-month office TCO is ₹3.84 crore under the managed model vs ₹5.90 crore traditional—saving ₹2.06 crore while freeing ₹44 lakh in blocked deposits.”
- Slide 2: The Savings Breakdown → Show CAPEX avoidance, operational efficiency, and deposit reduction.
- Slide 3: The Strategic Rationale → Speed to market, flexibility for headcount changes, leadership bandwidth preservation.
Final Words
The managed office model shifts operational complexity from the enterprise to the provider. The enterprise’s leadership bandwidth goes back to the business. For CFOs evaluating office strategy in 2026, the question is not whether a managed office costs less per square foot; the question is whether the total cost of ownership over 24-36 months, including capital allocation, operational bandwidth, and strategic flexibility, supports the decision. Related reading: Managed Office Space Guide 2026: Enterprise & GCC Strategy.
With India’s office market poised to breach 100 million sq. ft in leasing volumes within the next two years, and GCCs continuing to drive demand with aggressive expansion plans, the TCO model presented here provides the quantitative framework CFOs need before seeking board approval.


